
Government Spending Has Been Flat The Past 5 Years. No, Really!
Back in 2011, I looked at some CBO projections, and said that the country was in dire straits financially. Spending seemed to be on an absolute tear, and revenue–even if it lived up to wildly optimistic projections–wasn’t going to come close to keeping up.
Essentially, the CBO projections pointed to spending occurring at absolutely unprecedented levels, and relied on completely unrealistic projections of economic growth to [not quite even] pay for it. At the time, I said:
Even with those assumptions, where does spending fall historically? Even at these rosy projections, it never falls under 22% of GDP (on par with the highest spending the country has seen since WWII), and those rosy projections came in January 2010. A year later, in January 2011, the CBO outlook got worse. It now shows spending never falling under 23% of GDP during the decade 2011-2020. Historically, spending has not exceeded 23% of GDP for a single year between 1946 and 2008.
…
Where has revenue been over the last few decades? Well, for the years 1991-2000, during which time we suffered one mild recession followed by the tech bubble, total government revenue averaged 18.75% of GDP. For the years 2001-2010, where we dealt with the tech bubble collapse followed by the subprime bubble and then crash, total government revenue averaged 17.07% of GDP. A sizeable drop, to be sure (the worst spots being 2009 & 2010, where the financial crash slammed revenue below 15% of GDP). But fundamentally not that far out of line with historical precedent.
Now, I hadn’t gone back to look at the numbers since then. So I was very surprised to read a Cato post suggesting that spending was stagnant and was sitting at a mere 20.3% of GDP, not the 23%+ area that the CBO was projecting. As Daniel Mitchell from Cato puts it (emphasis added):
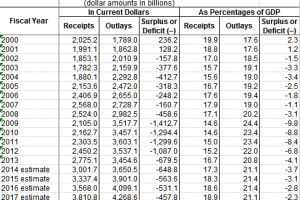
Here are some specific numbers culled from the OMB data and CBO data. In fiscal year 2009, the federal government spent about $3.52 trillion. In fiscal year 2014 (which ended on September 30), the federal government spent about $3.50 trillion.
In other words, there’s been no growth in nominal government spending over the past five years. It hasn’t received nearly as much attention as it deserves, but there’s been a spending freeze in Washington.
I was frankly shocked. So I ended up going straight to the OMB data (note: it’s an .xls file) to confirm.
Looks pretty legit. Spending was pushing well above 23% GDP for a few years due to the economic meltdown, the stimulus, and the continuing effects of global war.
What’s interesting, and I pulled this out of the graphic for clarity (go download the original source data if you want to confirm) is that this is NOMINAL spending. Considering there has been inflation since 2009, it’s actually fair to say that spending has decreased in real dollars over the last 5 years.
Spending is well below the CBO projections from 2010 that I used in my previous post. And frankly, revenue is WELL below their projections as well. But the spending restraint is sufficient to keep both spending as a percentage of GDP and deficits as a percentage of GDP in reasonable territory.
Now, there are always devils in the details. Mitchell points out a few in his post at Cato, and has even more to say on the subject here. But either way you slice it, the fiscal meltdown that many (including me 3 1/2 years ago) were predicting hasn’t come to pass.
Some on the left will credit Obama (even though they’ve never seen spending they didn’t like). Some on the right will credit the Tea Party (even though they spent the 8 years prior to Obama spending like a Kardashian wedding).
As for me, I’m just going to say that I’m glad my predictions–based on CBO projections–didn’t come to pass.